Vietnam Industry and Trade Growth Scenarios: Strategic Outlook 2026–2030
Growth scenarios for the Industry and Trade sector in the period 2026-2030
I. Basis and context for script development
The global economy in 2026 and the period up to 2030 is projected to continue to be complex and unpredictable, with new development trends creating new opportunities along with numerous challenges for economies around the world. Against the backdrop of the Fourth Industrial Revolution and the strong digital transformation, profound changes in economics, politics, and technology will continue to shape growth prospects and regional stability. In particular, breakthroughs in renewable energy and technology, and innovation will contribute to a diverse and promising economic landscape. The shift towards a circular economy and green transformation, where resources are reused to the maximum extent, will create economic opportunities in areas such as sustainable production, resource management, and smart agriculture, especially in the fields of technological transformation, renewable energy, and climate change adaptation.

Alongside new development opportunities, several instabilities and risks remain, posing challenges to macroeconomic stability and sustainable development in the coming years : The accelerated regionalization process through the signing of new-generation FTAs linking many countries within the same region and inter-regionally , along with the restructuring of global supply chains, will profoundly impact industrial and trade development ; the rise of trade protectionism, notably the increasing application of technical barriers , quality standards, green standards, and sustainability standards in trade to protect domestic industries ; and intense strategic competition between major powers, with the large-scale trade war between the US and China continuing as new tariff measures by the US administration against China and other countries persist. The technology war between the US and China is likely to intensify, especially in strategic areas such as 5G, semiconductors, AI, and cloud computing; unpredictable geopolitical tensions, the ongoing Israeli-Palestinian conflict coupled with economic instability, and instability in the Middle East are having a significant impact on the global economy and may escalate; the Russia-Ukraine conflict shows that tensions may continue before peaceful solutions are found; the trend of shifting global production and supply chains to enhance influence, including the shift in the center of power from West to East with the strong rise of China to consolidate its position in the world economy and more effectively respond to the containment and strategic competition of the US and Western countries; The BRICS bloc continues to expand in size and assert its position in the international system, promoting trade protectionist policies and de-dollarization to reduce dependence on Western economies, especially the US…
Against this backdrop, some forecasts still suggest that the global economy will continue to grow in the coming year. 2026 will continue to see stable growth. According to the latest OECD report, global GDP growth is projected to reach 3.3% in 2025, a slight increase from 3.2% in 2024, and remain stable at 3.3% in 2026.
Domestically , Vietnam has maintained political, social, and macroeconomic stability amidst the complex fluctuations of the global geopolitical and economic situation . Many sectors and fields continue to maintain positive production and business results thanks to the correct and timely leadership of the Central Government, the coordination, support, and supervision of the National Assembly, the involvement of the entire political system, the correct, decisive, practical, and effective direction and management of the Government, the Prime Minister, ministries, sectors, and localities, and the support and active participation of the business community. Our country’s strength and position have grown significantly, and Vietnam’s political standing in the ASEAN region and the world has been increasingly enhanced; the high degree of economic openness through accelerated international integration and expansion of liberalization, and the implementation of market opening commitments in new-generation FTAs, have had a positive impact on attracting foreign direct investment (FDI) for economic development.
Vietnam’s economic development in the 2026-2030 period – a crucial phase in implementing the 10-year socio-economic development strategy 2021-2030 – takes place against the backdrop of significant and comprehensive achievements in economic development during the first five years . This includes positive results in institutional reform and the transformation of the growth model towards greater depth , contributing to improved economic competitiveness based on innovative thinking, shifting from a command-and-administrative mindset to a technical one, focusing on innovation, digital transformation, and the development of science and technology, building a “development-oriented” state, along with policies encouraging development that expand growth opportunities and enhance the effectiveness of support for businesses, especially small and medium-sized enterprises.
In addition, the Government is striving to implement various solutions to promote production and business, remove difficulties for businesses, and create momentum for export growth and domestic consumption, aiming for Vietnam to become a developing country with modern industry and high middle income, promoting industrialization and modernization, digital transformation, green transformation, and sustainable economic development. The major policies and decisions issued and implemented in 2025 will begin to yield results, especially the four “Pillars” resolutions of the Politburo [1], along with the implementing resolutions of the National Assembly and the Government, which will create breakthroughs to help our country achieve double-digit economic growth from 2026. Notably, the implementation of a two-tiered local government system from July 1, 2025, along with the acceleration of digital transformation in state management, will not only help improve efficiency in managing and directing socio-economic development, increasing the ability to respond flexibly to actual development requirements, but also promote regional linkages, public investment, industrial production and exports, creating new “growth poles” in the region; At the same time, it helps reduce procedural costs, facilitates businesses, thereby helping to stabilize the macroeconomy and create a solid foundation for the sustainable development of the country in 2026 and beyond.
Besides the advantages, Vietnam’s economic and trade development in the coming period will have to face difficulties and challenges arising from the inherent weaknesses of the economy that are slow to be overcome ; The downward trend in competitiveness, despite continuous GDP growth, could exacerbate the reality of further economic backwardness , and the risk of falling into the middle-income trap remains very high . This is due to a shortage of financial resources and investment capital ; science , technology, and innovation not yet truly becoming the driving force for development ; slow infrastructure upgrades and outdated technology; limited management capacity of businesses; a lack of high-quality and skilled human resources, leading to low productivity, quality, and competitiveness of the economy as a whole and of businesses in particular ; and a slow process of economic restructuring linked to the innovation of a growth model based on science, technology, and innovation, failing to fully utilize the achievements of the Fourth Industrial Revolution .
Furthermore, there is a growing trend of non-traditional security challenges, particularly social issues. Issues such as poverty reduction , rapid population aging leading to pressure on the social security system , widening wealth inequality between urban, rural, and remote areas, mountainous regions, border areas, and islands; environmental problems , climate change , sea level rise, saltwater intrusion, natural disasters, epidemics … continue to unfold unpredictably , significantly impacting production and people’s lives, in addition to urbanization and industrialization creating immense pressure on infrastructure development and environmental pollution control.
In this context, the Ministry of Industry and Trade is playing an increasingly important role, serving as a key driving force to promote economic growth, industrial production growth, energy production, ensure supply-demand balance, stabilize the domestic market, accelerate international economic integration , leverage new generation FTAs to expand exports, increase imports of core technologies, and ensure energy, food, and trade security.
II. Perspectives on script development
Firstly , the growth scenario for the Industry and Trade sector must closely adhere to the national development goals for the 2026-2030 period, be consistent with and contribute to achieving socio-economic development goals , especially the goals of: rapid and sustainable growth; transforming the growth model towards in-depth development, applying modern science and technology; and improving the productivity, quality, efficiency, and competitiveness of the economy. Innovation, self-reliance, and deep integration into the international economy .
Secondly, the growth scenario must clearly reflect the structural shift in the Industry and Trade sector, innovating the growth model from extensive to intensive , in which: Industry shifts strongly towards high-tech processing and manufacturing industries and foundational industries; Energy develops towards security, sustainability, renewable energy , and emission reduction; Trade develops towards modernity, sustainability , domestic market stability , with exports as an important driving force, linked to digital transformation , green transformation, modernization of logistics and supply chains.
Thirdly, the growth scenario needs to be business-centric, based on the actual capabilities of domestic businesses and their ability to participate in global value chains ; market-oriented, focusing on developing the domestic market and expanding exports; the State plays a facilitating role in development , perfecting institutions and policies, creating a favorable, transparent, and stable business environment, and attracting domestic and foreign investment.
Fourth, the growth scenario for the Industry and Trade sector needs to ensure a balance between economic growth and sustainable development goals, linked to environmental protection , efficient resource utilization, promotion of green economy, circular economy, low-carbon economy, and contributing to the fulfillment of international commitments on emission reduction and just energy transition .
Fifth, the development of growth scenarios needs to be closely linked between the Ministry of Industry and Trade and other sectors and fields, clearly demonstrating regional and inter-sectoral linkages in the development of industry, trade, and logistics; as well as showcasing the role of the Ministry of Industry and Trade in supporting agriculture, services, urbanization, and the development of key economic regions.
Sixth , the development of growth scenarios must ensure feasibility and alignment with actual resources (investment, labor, infrastructure, technology); and include specific quantitative targets for each sector (industry, energy, domestic trade, import and export). It is linked to a monitoring and evaluation system and can be flexibly adjusted during implementation.
Seventh, the development of growth scenarios must be based on a comprehensive assessment of the domestic and international context, identifying opportunities and challenges, risks related to energy, raw materials, logistics, and export markets. This will allow for flexible options , ensuring the ability to proactively adapt and respond promptly to external shocks and fluctuations.
III. General Assumptions for the Industry and Trade Sector Growth Scenario in the Period 2026-2030
– The global economy is growing at a moderate pace, and the trend of restructuring and diversifying supply chains continues.
Vietnam’s macroeconomic situation remains stable, and the investment and business environment has improved.
– Macroeconomic policies are managed flexibly, with close coordination between fiscal, monetary, trade, and investment policies. New generation FTA agreements (CPTPP, EVFTA, UKVFTA, etc.) continue to be implemented effectively.
– The processing and manufacturing industries receive focused investment, domestic trade continues to play an important supporting role, and exports are the main driving force for economic growth.
– Science and technology, innovation, digital transformation, green transformation, and renewable energy are promoted in industrial and commercial sectors.
IV. Growth Scenarios for the Industry and Trade Sector in the Period 2026-2030
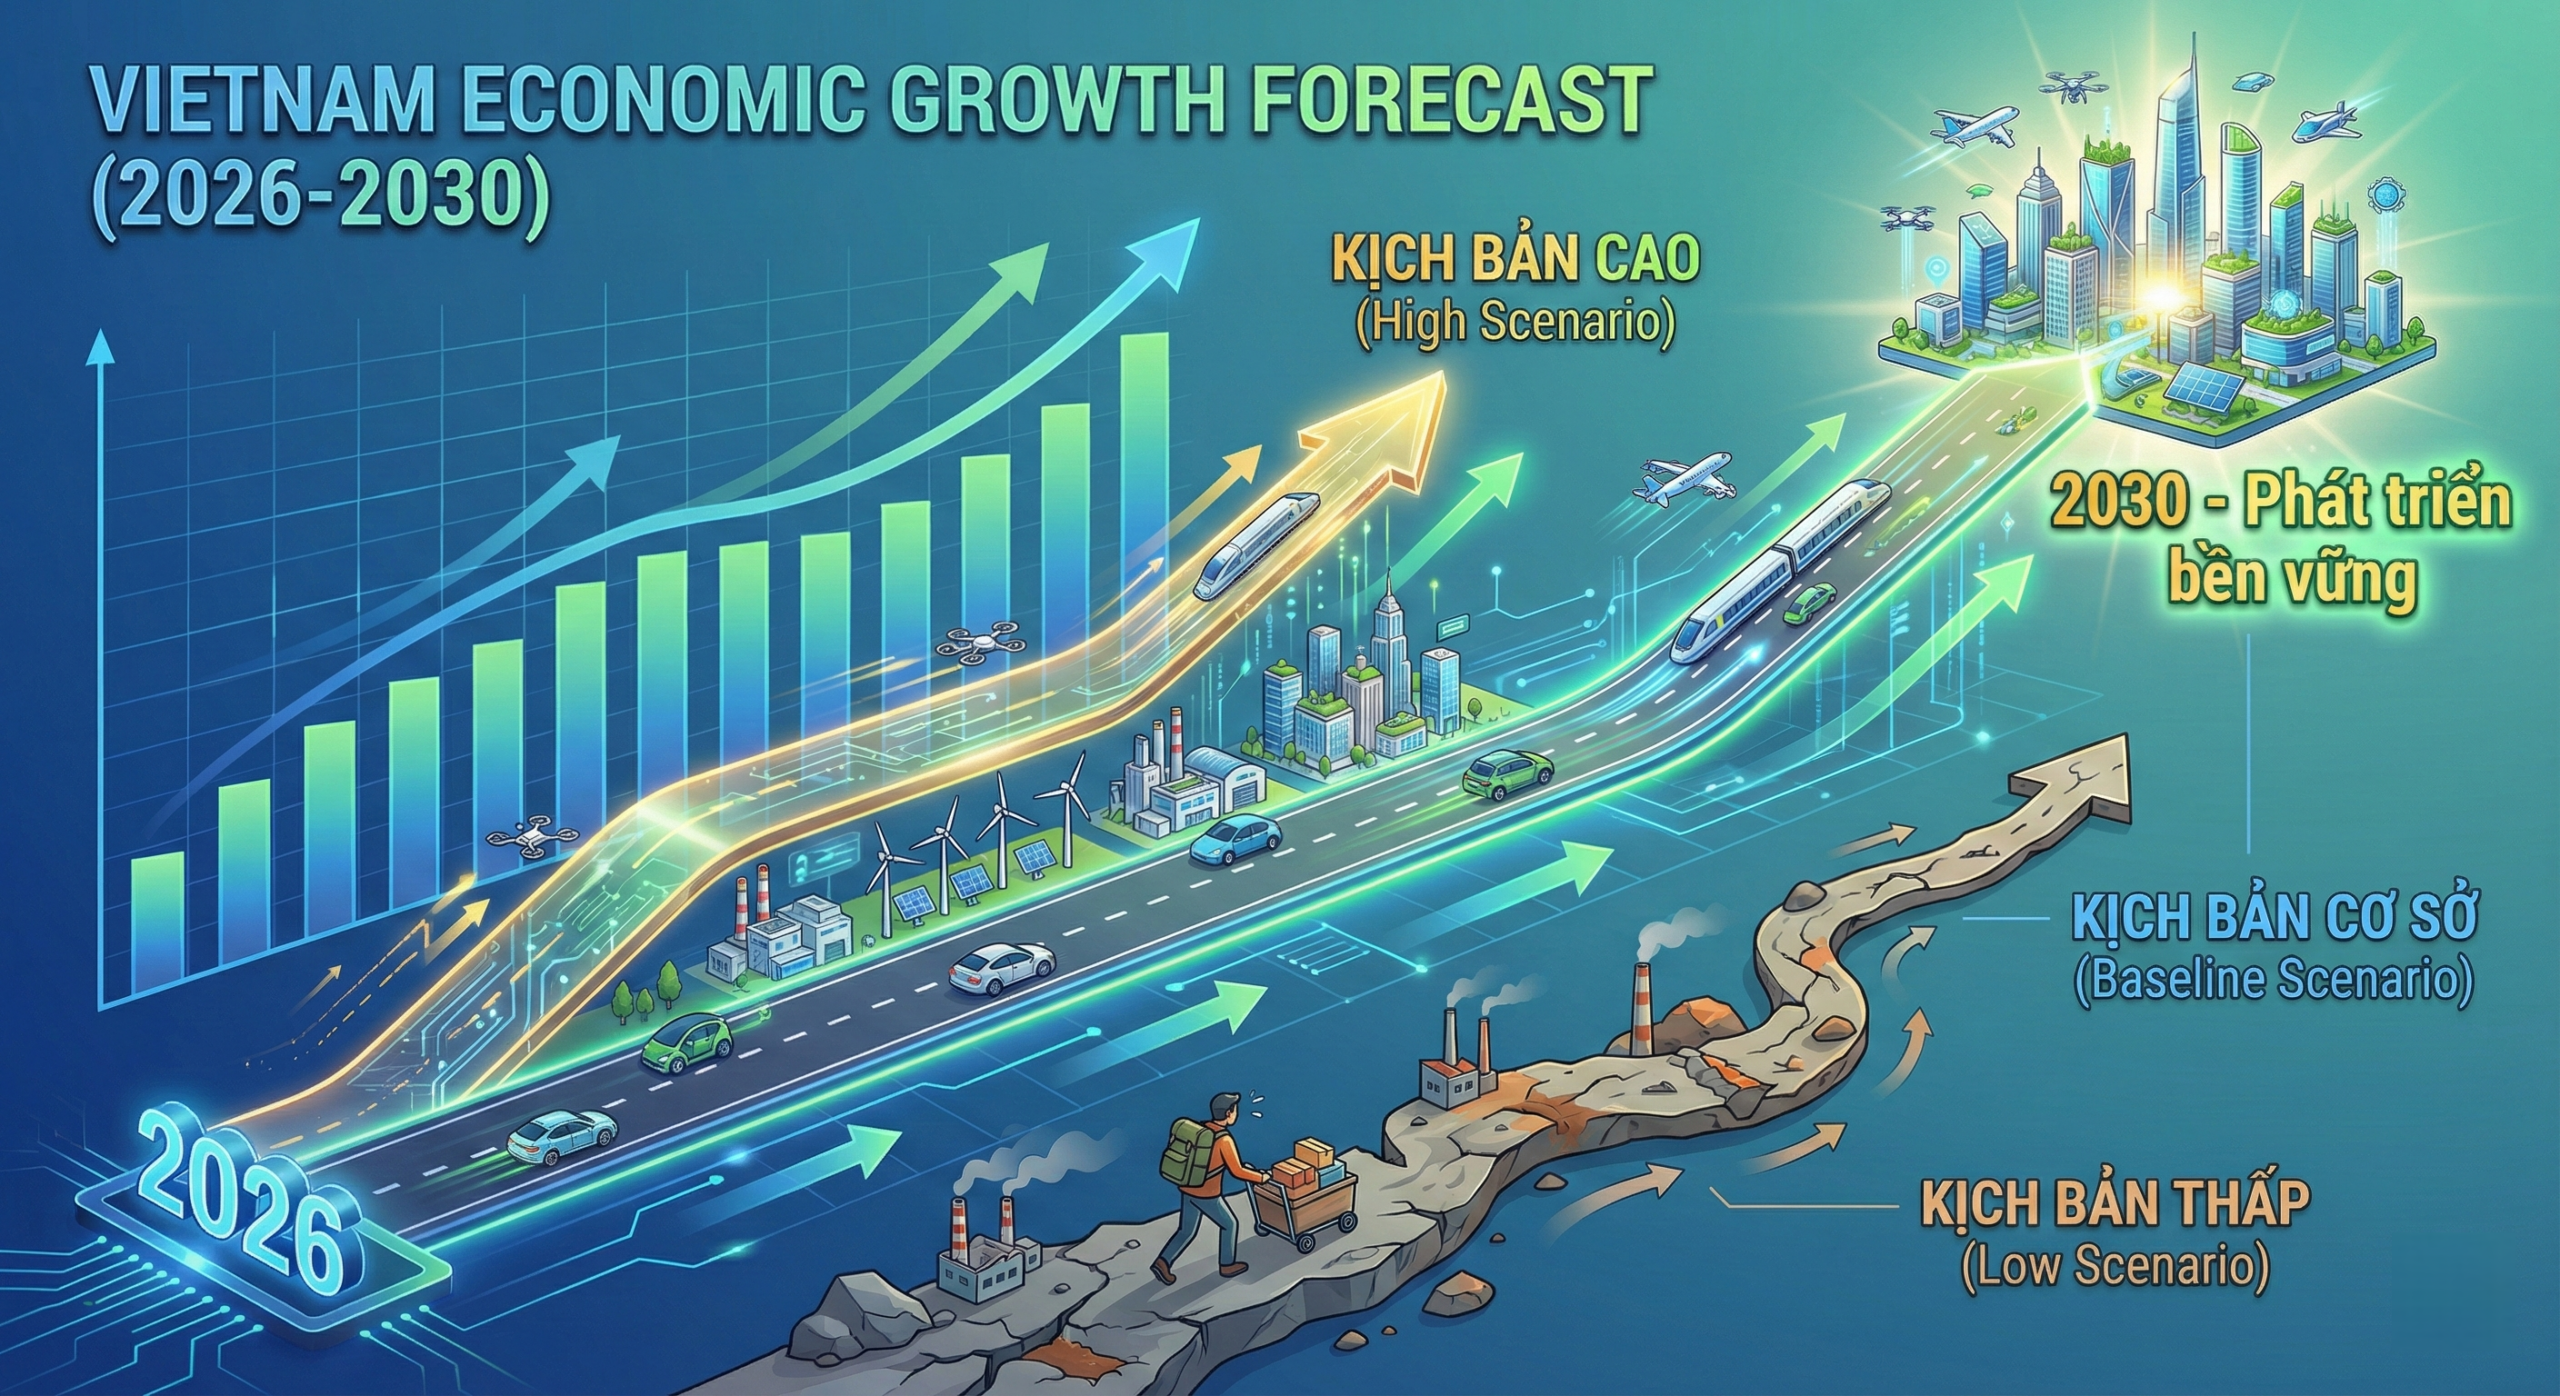
4.1. Scenario 1: Baseline Scenario ( feasible scenario, balancing growth and macroeconomic stability )
Assumption
– The global economy is recovering slowly, and international market demand is increasing at a moderate pace.
– No major shocks to energy, trade, or finance occurred.
– Institutional and administrative procedure reforms in the field of Industry and Trade have been effective; policies supporting production and exports have been implemented synchronously; the proportion of processing and manufacturing industries continues to increase in the industrial structure; the industrial sector’s contribution to GDP continues to grow.
– GDP is projected to grow by an average of 10%, in line with the double-digit economic growth target.
Key growth targets
– Growth in the Industrial Production Index (IIP): 9-10% per year .
– Growth rate of the processing and manufacturing industry: 10 – 11% per year .
– Industrial sector’s contribution to GDP : 37-42% (current prices)
– The manufacturing sector’s contribution to GDP : 30-35% (current prices)
– The proportion of processing and manufacturing industries in the industrial sector: 84 – 85%.
– Localization rate for some key industries: 50 – 55%.
– Growth in commercial electricity output: 9.8 – 10.3 % per year .
– Growth in the value of goods exports: 10 – 11% per year .
– Growth in total retail sales of goods and consumer service revenue: 11 – 11.5% per year.
– E-commerce sales growth : 15-20% per year, accounting for 15-20% of total retail sales of goods and consumer services revenue.
– Aim for approximately 40-45% of small and medium-sized enterprises to participate in e-commerce platforms.
Operational orientation
– Focus on stabilizing the domestic market, controlling supply and demand, and the prices of essential goods.
– Develop logistics and integrated commercial infrastructure.
– Maintain growth in the processing and manufacturing industries, improve productivity, quality, and efficiency; develop supporting industries.
– Effectively utilize traditional FTA markets, expand into new markets, niche markets, and Halal markets.
4.2 . Scenario 2: High-growth scenario (favorable scenario, achieving rapid and sustainable development goals).

Assumption
– The global economy is recovering better than expected; consumer demand and international investment are increasing.
– FDI inflows into processing, manufacturing, energy, and logistics industries have increased significantly; technology and resources have seen breakthrough investments; the proportion of processing and manufacturing industries continues to grow, and distinct industrial-commercial value chains are being formed.
– Institutional reforms, administrative procedures, and digital transformation in the industry and trade sector have achieved high efficiency and breakthroughs.
Main growth targets
– Growth in the Industrial Production Index (IIP): 11-12% per year .
– Growth rate of the processing and manufacturing industry: 12-13% per year .
– Industrial sector’s contribution to GDP : 42-47% (current prices)
– The manufacturing sector’s contribution to GDP is 35-40% (current prices).
– The proportion of processing and manufacturing industries in the industrial sector: 86 – 87%.
– Localization rate for some key industries: 55 – 60%.
– Growth in commercial electricity output: 11.5 – 12.5% per year.
– Growth in the value of goods exports: 11-12 % per year .
– Growth in total retail sales of goods and consumer service revenue: 11.5 – 12.5%/year .
– E-commerce sales growth : 20-25% per year, accounting for 20-25% of total retail sales of goods and consumer services revenue.
– Aim for approximately 45-50% of small and medium-sized enterprises to participate in e-commerce platforms.
Operational orientation
– Promote the development of foundational industries, high-tech industries, and renewable energy.
– Promote the export of processed and manufactured industrial goods with high added value; make Vietnam an important production and export center in a number of key industries.
– Develop a modern distribution system, Cross-border e-commerce, green logistics, and sustainable supply chain connectivity.
– Linking industrial and commercial development with digital transformation, green transformation, and the circular economy; applying big data in market forecasting and policy making.
4.3 . Scenario 3: Low Growth Scenario (Adverse scenario, contingency plan for flexible management in unfavorable international context ).
Assumption
– The global economy is experiencing a prolonged downturn; international consumer demand and investment are declining.
– Geopolitical conflicts and increased trade protectionism.
– Energy and logistics costs are highly volatile.
– Foreign direct investment (FDI) into the processing and manufacturing industry has decreased sharply.
– Institutional and administrative procedure reforms in the field of Industry and Trade have been slow and have not yielded the desired results.
Key growth targets
– Growth in the Industrial Production Index (IIP): 7-8% per year .
– Growth rate of the processing and manufacturing industry: 8-9 % per year .
– Industrial sector’s contribution to GDP : 32-37% (current prices)
– The manufacturing sector’s contribution to GDP : 25-30% (current prices)
– The proportion of processing and manufacturing industries in the industrial sector: 82 – 83%.
– Localization rate for some key industries: 45 – 50%.
– Growth in commercial electricity output: 8.3 – 8.9% per year.
– Growth in the value of goods exports: 9 – 10% per year .
– Growth in total retail sales of goods and consumer service revenue: 10.5 – 11% per year.
– E-commerce sales growth : 12-15% per year, accounting for 10-15% of total retail sales of goods and consumer services revenue.
– Aim for approximately 35-40% of small and medium-sized enterprises to participate in e-commerce platforms.
Operational orientation
– Prioritize stabilizing the domestic market and ensuring the supply of essential goods; strengthen market management and combat trade fraud; and ensure energy security.
– Support businesses in maintaining production and minimizing supply chain disruptions.
– Strengthen trade promotion, effectively exploit traditional FTA markets, and diversify export markets and products.

Table: Some key growth indicators of the Industry and Trade sector for the period 2026-2030 according to different scenarios.
Unit: %/year
| TT | Key indicators | Low scenario | Base scenario | High-scenario |
| Industrial Sector | ||||
| 1 | Growth in the Industrial Production Index (IIP) | 9 – 10 | 10 – 11 | 12 – 1 3 |
| 2 | Growth of the processing and manufacturing industry | 10 – 11 | 11 – 12 | 13 – 1 4 |
| 3 | Industrial structure in GDP ( %, current price ) | 37 – 39 | 39 – 41 | 43 – 45 |
| 4 | The structure of the processing and manufacturing industry in GDP. ( %, current price ) | 25 – 30 | 30 – 35 | 35 – 40 |
| 5 | The proportion of processing and manufacturing industries in the industrial sector. (%) | 82 – 83 | 84 – 85 | 86 – 87 |
| 6 | The proportion of value of high-tech industrial products in processing and manufacturing industries. | 42 – 45 | 45 – 48 | 48 – 50 |
| 7 | Localization rate of some key processing and manufacturing industries (electricity, electronics, textiles, etc.) (%) | 45 – 50 | 50 – 55 | 55 – 60 |
| 8 | Percentage of industrial enterprises applying digital technology (%) | 35 – 40 | 45 – 50 | 55 – 60 |
| 9 | Industrial value added/GDP (%) | 24 – 25 | 25 – 26 | 26 – 27 |
| 10 | The proportion of the workforce in the industrial and service sectors. | 65 – 70 | 70 – 72 | 72 – 75 |
| 11 | Percentage of industrial establishments adopting green production (%) | 25 – 30 | 35 – 40 | 45 – 50 |
| 12 | Industrial value-added growth rate (Based on the proposal: Resolution No. 23-NQ/TW dated March 22, 2018) | 8.0 – 8.5 | 8.5 – 8.8 | 8.8 – 9.2 |
| 13 | Labor productivity growth rate in the industrial sector (Based on the proposal: Decision No. 1305/QD-TTg dated November 8, 2023) | 6.5 – 7.0 | 7.0 – 7.5 | 7.5 – 8.0 |
| 14 | Industrial Competitiveness Performance Index (CIP) (Based on the proposal: Resolution No. 23-NQ/TW dated March 22, 2018) | Ranked among the top 5 ASEAN countries. | Ranked among the top 3 countries in ASEAN. | Ranked among the top 3 ASEAN countries. |
| Energy sector | ||||
| 1 | Growth in commercial electricity production | 8.3 – 8.9 | 9.8 – 10.3 | 11.5 – 12.5 |
| 2 | Renewable energy share in the power generation mix (%) (excluding hydropower) | 28 – 31 | 31 – 34 | 34 – 36 |
| 3 | Electrical elasticity coefficient/GDP (times) | ≤1.25 | ≤1.2 | ≤1.15 |
| 4 | Self-consumption rate and power loss (%) | ≤10.7 | ≤10.7 | ≤10.7 |
| 5 | New renewable energy capacity added (GW) | ~70 | ~ 77 | ~ 82 |
| 6 | Percentage of industrial enterprises applying energy-saving and efficient energy use solutions (%) | 50 – 55 | 60 – 65 | 70 – 75 |
| 7 | CO₂ emissions per unit of GDP (reduction %) | 5 – 7 | 8 – 10 | 12 – 15 |
| 8 | Primary energy supply/GDP (Based on the proposal: Decision No. 165/QD-TTg dated February 28, 2023) | 1.0 | 1.3 | 1.5 |
| 9 | Total electricity output of the entire system (Based on the proposal: Resolution No.) 70 – NQ/TW dated August 20, 2025) | ~ 11 | ~12.6 | ~13.5 |
| 10 | Energy intensity (Final energy consumption/GDP) (Based on the proposal: Decision No. 215/QD-TTg dated March 1, 2024 ) | ~ 1.0 | ~ 1.2 | ~ 1.5 |
| International trade | ||||
| 1 | Growth in the value of goods exports. | 9 – 10 | 10 – 11 | 11 – 12 |
| 2 | Percentage of exports of processed and manufactured goods (%) | 85 – 86 | 87 – 88 | 89 – 90 |
| 3 | Percentage of green, environmentally friendly product exports (%) | 20 – 25 | 30 – 35 | 40 – 45 |
| 4 | FTA preferential utilization rate (%) | 45 – 50 | 55 – 60 | 65 – 70 |
| 5 | Number of export markets with turnover exceeding 1 billion USD (markets) | 35 – 37 | 38 – 40 | 42 – 45 |
| 6 | Average growth rate of total export turnover (%) | |||
| 7 | Export turnover growth by some key commodities (%) | |||
| 8 | Export growth by major markets (%) | |||
| 9 | Average growth rate of total import value (%) | |||
| 10 | Import turnover growth by item (%) | |||
| 11 | Import turnover growth by major markets (%) | |||
| Domestic trade | ||||
| 1 | Growth in total retail sales of goods and consumer service revenue. | 12 – 13 | 13 – 14 | 1 4 – 1 5 |
| 2 | E -commerce sales growth (%) | 18 – 20 | 20 – 22 | 23 – 25 |
| 3 | Percentage of goods distributed through e-commerce channels (%) | 11 – 13 | 14 – 16 | 16 – 18 |
| 4 | Percentage of goods distributed through modern retail systems (%) | 32 – 38 | 38 – 42 | 42 – 45 |
| 5 | Percentage of small and medium-sized enterprises participating in e-commerce platforms (%) | 35 – 40 | 40 – 45 | 45 – 50 |
| 6 | Percentage of Vietnamese goods in the distribution system (%) | 80 – 82 | 83 – 85 | 86 – 88 |
| 7 | Retail sales share of domestic economic sector (%) | 75 – 80 | 82 – 85 | 85 – 88 |
| 8 | Distribution system coverage level (% of communes/wards) | 85 – 88 | 90 – 92 | 95+ |
| 9 | Logistics costs as a percentage of GDP (Based on the proposal: Decision No. 165/QD-TTg dated February 28, 2023) | 15 – 18 | 10 – 15 | 8 – 10 |
[1]Resolution No. 57-NQ/TW dated December 22, 2024, of the Politburo on breakthroughs in the development of science, technology, innovation, and national digital transformation; Resolution 59-NQ/TW dated January 24, 2025, of the Politburo on international integration in the new situation; Resolution No. 68-NQ/TW dated May 4, 2025, of the Politburo on the development of the private economy; and Resolution No. 66-NQ/TW dated April 30, 2025, on reforming the work of drafting and implementing laws to meet the requirements of national development in the new era.